Movies
Oocytes Undergoing Germinal Vesicle Breakdown and Meiotic Maturation
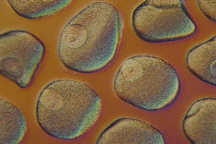
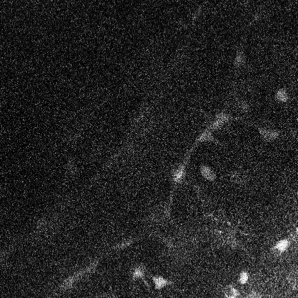
Pisaster ochraceus seastar oocytes undergoing germinal vesicle breakdown in response to treatment with 1-methyladenine. Seastar oocytes typically have a diameter of about 150 microns and are shown under phase contrast to visualize the nucleus and nucleolus. A photograph was taken every minute for a period of 30 minutes to 90 minutes after the addition of the 1-methyladenine. During this period, there is a large burst in protein phosphorylation. Kinexus has performed detailed analysis of this model system in order to further knowledge about cell cycle regulation by protein kinases. (Credits: Gordon Leung and Harry Paddon)
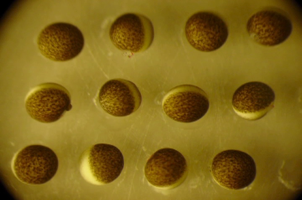
Xenopus laevis African clawed frog oocytes undergoing germinal vesicle breakdown in response to treatment with progesterone. Frog oocytes typically have a diameter of about 1.50 millimeters and are shown under normal light to visualize the release of yolk proteins at the top of the dark animal hemisphere of these oocytes following the disintegration of the nuclear membrane. A photograph was taken every 10 minutes for a period of 4 h to 9 hours after the addition of the progesterone. During this period, there is a large burst in protein phosphorylation. Kinexus has performed detailed analysis of this model system in order to further knowledge about cell cycle regulation by protein kinases. (Credits: Gordon Leung and Harry Paddon)
The following web links provide compelling microscopic images of bodies, tissues and cells.
The Visible Human Project - Man. Animation of the human body obtained from sequential thin cross-sections of a male cadaver prepared by the United States National Library of Medicine NIH.
Mouse and Rat Brain Slices with Cerebral Blood Flow Constrictions
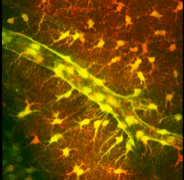
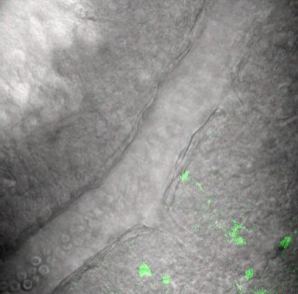
Three-dimensional projection of merged image stacks of glial fibrillary acidic protein-green fluorescent protein (GFAP/EGFP) (which visualizes astrocytes) and the fluorescence of the long wavelength Ca2+ indicator Rhod-2-AM (which visualizes an arteriole) displays the selective loading of astrocytes and their endfeet. Neurons and vascular elements did not load with these indicators. (Credits: Dr. Brian MacVicar (bmacvica@interchange.ubc.ca) and Sean Mulligan)
Selective Ca2+ uncaging in the two astrocytes in the center of the field by two-photon photolysis of the acetoxymethyl ester Ca2+ cage DMNP-EDTA which triggers a Ca2+ wave that propagated through the astrocyte syncytium. The Ca2+ indicator Rhod-2 monitors the [Ca2+]i. Red marks indicate 10 ms laser flashes in astrocytes. Acquisition rate = 1.9 sec/frame (86 frames). (Credits: Dr. Brian MacVicar (bmacvica@interchange.ubc.ca) and Sean Mulligan)
Two-photon photolysis of DMNP-EDTA in astrocyte (red mark) initiates a Ca2+ wave that propagated into the astrocytes and astrocyte endfeet along the vessel wall. Acquisition rate = 3.9 sec/frame (66frames). (Credits: Dr. Brian MacVicar (bmacvica@interchange.ubc.ca) and Sean Mulligan)
Two-photon transmitted and Ca2+ indicator fluorescence overlay showing arteriole constriction resulting from Ca2+ wave that propagates along the vessel wall (same experiment as in MacvicarMovie3ACalciumWave.mov). Note the appearance of red blood cells within the constricting arteriole. (Credits: Dr. Brian MacVicar (bmacvica@interchange.ubc.ca) and Sean Mulligan)
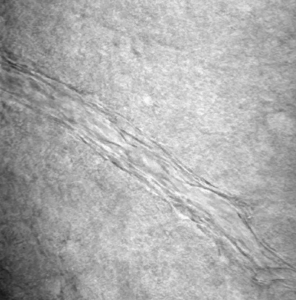
Two-photon transmitted image series showing an arteriole constriction induced by a Ca2+ wave initiated in the astrocyte marked by the red symbol. This is the fourth constriction of this vessel. Acquisition rate = 6 sec/frame (45 frames). (Credits: Dr. Brian MacVicar (bmacvica@interchange.ubc.ca) and Sean Mulligan)
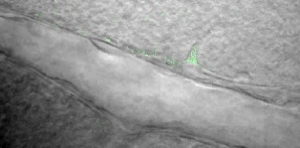
Two-photon transmitted and Ca2+ indicator fluorescence overlay showing arteriole constriction restricted to the region adjacent to the Ca2+ rise in the single astrocyte endfoot resulting from a Ca2+ wave initiated out of frame. Acquisition rate = 3.1 sec/frame (61 frames). (Credits: Dr. Brian MacVicar (bmacvica@interchange.ubc.ca) and Sean Mulligan)
Caenorhabditis elegans Crawling in Response to Shaking
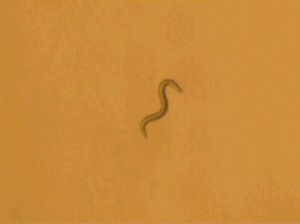
A movie showing the crawling response of the worm to shaking of the culture plate. Note that the worm stops and then crawls the opposite direction. (Credits: Dr. Catharine Rankin (crankin@psych.ubc.ca)
Website link:
C. elegans Movies - A visual introduction to the Nobel Prize-winning worm Caenorhabditis elegans that features a wide range of movies made by researchers worldwide.
http://www.bio.unc.edu/faculty/goldstein/lab/movies.html
http://www.bio.unc.edu/faculty/goldstein/lab/movies.html