Charts & Graphs
Kinexus is pleased to make available a large selection of signal transduction–related slides in Adobe PDF format that may be freely used for teaching purposes. These slides were produced by Kinexus and are copyrighted for commercial purposes. These PDF documents are ready to import into Microsoft PowerPoint Presentations.
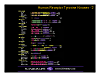
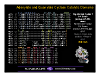
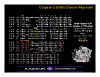
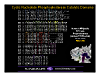
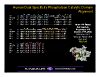
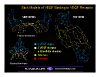
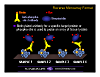
Evolutionary Relatedness Trees for Cell Signalling Proteins
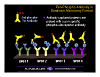
Domain Distribution in Cell Signalling Proteins
Alignment of Amino Acids in Catalytic Domains of Cell Signalling Proteins
Protein Phosphorylation
Protein Kinases – General
Calcium/Calmodulin Regulated Protein Kinase Signalling and PKC
Mitogen Activated Protein Kinase Signalling
Domain Distribution in Cell Signalling Proteins
Alignment of Amino Acids in Catalytic Domains of Cell Signalling Proteins
Protein Phosphorylation
Protein Kinases – General
Calcium/Calmodulin Regulated Protein Kinase Signalling and PKC
Mitogen Activated Protein Kinase Signalling
Back to the Top
Back to the Top
Back to the Top
Back to the Top
Back to the Top
Back to the Top
Back to the Top
Back to the Top
Back to the Top
Back to the Top
Back to the Top
Back to the Top
Back to the Top
Back to the Top
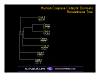
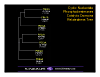
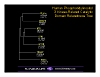
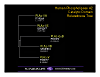
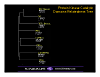
Evolutionary Relatedness Trees for Cell Signalling Proteins
| Chart | Title |
|---|---|
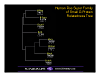
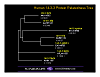 | Human 14—3—3 Protein Relatedness Tree Click here to view. |
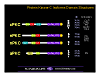
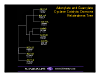 | Human Adenylate and Guanylate Cyclase Catalytic Domains Relatedness Tree Click here to view. |
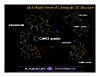
 | Human Caspase Catalytic Domains Relatedness Tree Click here to view. |
 | Human Cyclic Nucleotide Phosphodiesterases Catalytic Domains Relatedness Tree Click here to view. |
 | Human Cyclin Family Relatedness Tree Click here to view. |
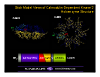
 | Human Dual Specificity Phosphatase Catalytic Domain Relatedness Tree Click here to view. |
 | Human G Protein Alpha Subunits Relatedness Tree Click here to view. |
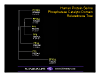
 | Human Phosphatidylinositol–Specific Phospholipase C Catalytic Domain Relatedness Tree Click here to view. |
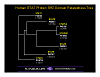
 | Human Phosphatidylinositol 3 Kinase–Related Catalytic Domain Relatedness Tree Click here to view. |
 | Human Phospholipase A2 Catalytic Domain Relatedness Tree Click here to view. |
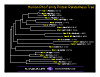
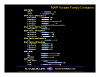
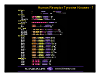
 | Human Protein Kinase Catalytic Domains Relatedness Tree Click here to view. |
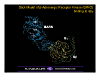
 | Human Ras Family Protein Relatedness Tree Click here to view. |
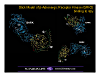
 | Human Ras Super Family of Small G Protein Relatedness Tree Click here to view. |
 | Human Rho Family Protein Relatedness Tree Click here to view. |
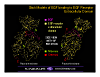
 | Human Protein–Serine Phosphatase Catalytic Domain Relatedness Tree Click here to view. |
 | Human STAT Protein SH2 Domain Relatedness Tree Click here to view. |
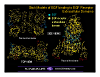
 | Human Protein–Tyrosine Phosphatase Catalytic Domain Relatedness Tree Click here to view. |
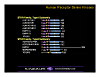
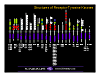
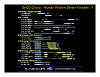
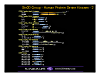
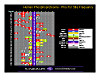
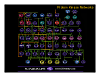
Domain Distribution in Cell Signalling Proteins
| Chart | Title |
|---|---|
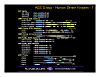 | AGC Group — Human Serine Kinases Domains — 1 Click here to view. |
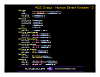 | AGC Group — Human Serine Kinases Domains — 2 Click here to view. |
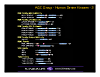 | AGC Group — Human Serine Kinases Domains — 3 Click here to view. |
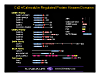 | Ca2+/Calmodulin — Regulated Protein Kinases Domains Click here to view. |
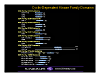 | Cyclin — Dependent Kinase Family Domains Click here to view. |
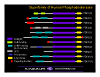 | Superfamily of Human Phosphodiesterases Click here to view. |
 | Human Cyclins Domains Click here to view. |
 | MAP Kinase Family Domains Click here to view. |
 | Human Non-Receptor Tyrosine Kinases Domains Click here to view. |
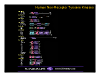
 | Protein Kinase C Isoforms Domain Structures Click here to view. |
 | Human Receptor Tyrosine Kinases Domains — 1 Click here to view. |
 | Human Receptor Tyrosine Kinases Domains — 2 Click here to view. |
 | Human Receptor — Serine Kinases Click here to view. |
 | Structures of Receptor — Tyrosine Kinases Click here to view. |
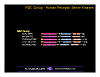 | RGC Group — Human Receptor Serine Kinases Domains Click here to view. |
 | SH2, PTB and SH3 Domain Interactions Click here to view. |
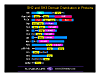 | SH2 and SH3 Domain Distribution in Proteins Click here to view. |
 | Ste20 Group — Human Serine Kinases Domains — 1 Click here to view. |
 | Ste20 Group — Human Protein–Serine Kinases Domains — 2 Click here to view. |
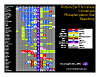
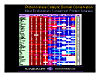
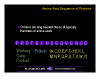
Alignment of Amino Acids in Catalytic Domains of Cell Signalling Proteins
| Chart | Title |
|---|---|
 | Human Adenylate and Guanylate Cyclase Catalytic Domain Amino Acid Alignment Click here to view. |
 | Human Caspase Catalytic Domain Amino Acid Alignment Click here to view. |
 | Human Cyclic Nucleotide Phosphodiesterase Catalytic Domain Amino Acid Alignment Click here to view. |
 | Human Protein — Tyrosine Phosphatase Catalytic Domain Amino Acid Alignment Click here to view. |
 | Human G Protein Alpha Subunits Amino Acid Alignment Click here to view. |
 | Human PI — Specific Phospholipase C Catalytic Domain Amino Acid Alignment Click here to view. |
 | Human Phosphatidylinositol 3 Kinase-Related Catalytic Domain Amino Acid Alignment Click here to view. |
 | Human Phospholipase A2 Catalytic Domain Amino Acid Alignment Click here to view. |
 | Human Protein Kinase Catalytic Domain Amino Acid Alignment Click here to view. |
 | Human Ras-Related Small G Proteins Amino Acid Alignment Click here to view. |
 | Human Protein-Serine Phosphatase Catalytic Domain Amino Acid Alignment Click here to view. |
| Human Protein-Tyrosine Phosphatase Catalytic Domain Amino Acid Alignment Click here to view. |
Protein Phosphorylation
| Chart | Title |
|---|---|
 | Human Protein Phosphorylation By Kinases Click here to view. |
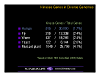
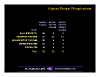
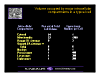
 | Number and Percentage of Tyrosine, Serine and Threonine Phospho–Sites Click here to view. |
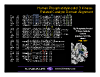
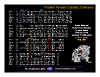
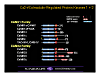
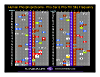 | Human Phosphoproteome — Phospho–Serine and Phospho–Threonine Consensus Phosphorylation Site Frequency Click here to view. |
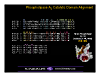
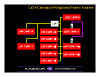
 | Human Phosphoproteome — Phospho–Tyrosine Consensus Phosphorylation Site Frequency Click here to view. |
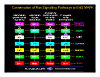
 | Conservation of Human Phospho-Sites in Other Species Click here to view. |
 | Protein-Serine/Threonine Kinase Consensus Phosphorylation Site Specificity Click here to view. |
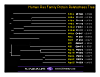
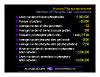
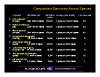
Protein Kinases – General
| Chart | Title |
|---|---|
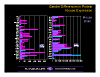 | Gender Differences in Protein Kinase Expression – Mouse Brain Click here to view. |
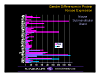 | Gender Differences in Protein Kinase Expression – Mouse Submandibular Gland Click here to view. |
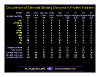 | Occurrence of Selected Binding Domains in Protein Kinases Click here to view. |
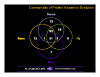 | Commonality of Protein Kinases in Evolution Click here to view. |
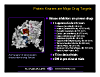
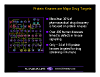 | Protein Kinases are Major Drug Targets Click here to view. |
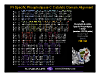
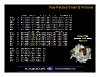
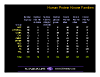 | Human Protein Kinase Families – Phospho–Sites Table Click here to view. |
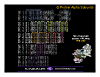
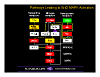
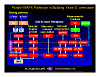
 | Protein Kinase Inhibitors Approved and in Development Click here to view. |
 | Tissue Differences in Protein Kinase Protein Expression – Part 1 Click here to view. |
 | Tissue Differences in Protein Kinase Protein Expression – Part 2 Click here to view. |
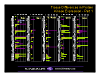
 | Kinetworks™ Multi-Immunoblotting Click here to view. |
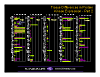
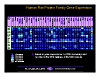
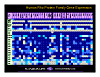
 | Kinetworks™ Phospho–Site Multi-Immunoblot Jurkat T Cells –Staurosporin Treated Overnight Click here to view. |
 | Protein Kinase Catalytic Domain Conservation – Most Evolutionary Conserved Protein Kinases Click here to view. |
 | Protein Kinase Dimerization Click here to view. |
 | Protein Kinase Genes in Diverse Genomes Table Click here to view. |
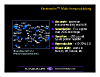
 | Protein Kinase Networks Click here to view. |
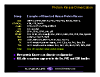
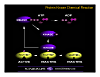 | Protein Kinase Chemical Reaction Click here to view. |
Calcium/Calmodulin Regulated Protein Kinase Signalling and PKC
| Chart | Title |
|---|---|
 | Ca2+/Calmodulin–Regulated Protein Kinases 1 + 2 Families Click here to view. |
 | Ca2+/Calmodulin–Regulated Protein Kinases Interactions Click here to view. |
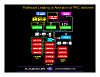 | Pathways Leading to Activation of PKC Isoforms Click here to view. |
Mitogen Activated Protein Kinase Signalling
| Chart | Title |
|---|---|
 | Pathways Leading to Erk2 MAPK Activation Click here to view. |
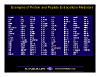
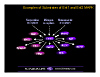 | Examples of Substrates of Erk1 and Erk2 MAPK Click here to view. |
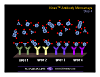
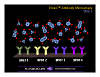
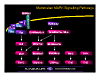 | Mammalian MAPK Signalling Pathways Click here to view. |
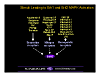
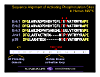 | Sequence Alignment of Activating Phosphorylation Sites in Human MAPK Click here to view. |
 | Parallel MAPK Pathways in Budding Yeast S. cerevisiae Click here to view. |
 | Conservation of Ras Signalling Pathways to Erk2 MAPK Click here to view. |
 | Stimuli Leading to Erk1 and Erk2 MAPK Activation Click here to view. |
Cyclin–Dependent Protein Kinase Signalling
| Chart | Title |
|---|---|
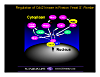 | Regulation of Cdc2 kinase in Fission Yeast S. Pombe Click here to view. |
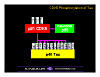 | CDK5 Phosphorylation of Tau Click here to view. |
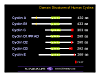
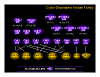 | Cyclin–Dependent Kinase Family Click here to view. |
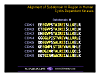 | Alignment of Subdomain III Region in Human Cyclin–Dependent Kinases Click here to view. |
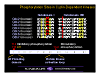 | Phosphorylation Sites in Cyclin–Dependent Kinases Click here to view. |
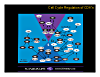 | Cell Cycle Regulation of CDK’s Click here to view. |
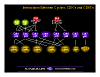 | Interactions Between Cyclins, CDK’s and Cyclin–Dependent Kinase Inhibitors Click here to view. |
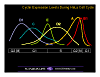 | Cyclin Expression Levels During HeLa Cell Cycle Click here to view. |
Protein Phosphatases – General
| Chart | Title |
|---|---|
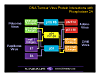 | DNA Tumour Virus Protein Interactions with Phosphatase 2A Click here to view. |
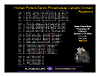
 | Human Protein Protein Phosphatase Families Table Click here to view. |
G Protein Signalling
| Chart | Title |
|---|---|
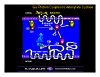
 | 7TM Receptors Couple to G Proteins Diagram Click here to view. |
 | G? Protein Couples to Adenylate Cyclase Diagram Click here to view. |
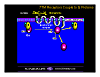
 | G Protein Stimulation of Phospholipase C Isoforms Click here to view. |
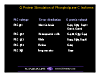
 | Human Ras Protein Family Gene Expression Click here to view. |
 | Human Rho Protein Family Gene Expression Click here to view. |
3D Stick Structural Models of Cell Signalling Proteins
| Chart | Title |
|---|---|
 | ?–Adrenergic Receptor Kinase (GRK2) binding to G??~1 Stick Model Click here to view. |
 | ?–Adrenergic Receptor Kinase (GRK2) binding to G??~1 Stick Model Click here to view. |
 | Calmodulin 3D Stick Model Click here to view. |
 | Calmodulin–Dependent Kinase 2 Holoenzyme Structure Stick Model Click here to view. |
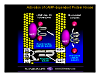
 | Epidermal Growth Factor binding to EGF Receptor Extracellular Domain – 1 Stick Models Click here to view. |
 | Epidermal Growth Factor binding to EGF Receptor Extracellular Domains – 2 Stick Models Click here to view. |
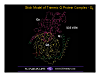 | Trimeric G Protein Complex – Gt Stick Model Click here to view. |
 | Vascular Endothelial Growth Factor Binding to VEGF Receptor Stick Models Click here to view. |
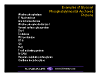
Covalent Modification of Cell Signalling Proteins
| Chart | Title |
|---|---|
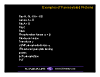 | Examples of Farnesylated Proteins Click here to view. |
 | Examples of Glycosyl Phosphatidylinositol Anchored Proteins Click here to view. |
 | Examples of Myristoylated Proteins Click here to view. |
 | Examples of Palmitoylated Proteins Click here to view. |
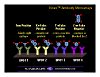
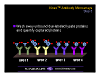
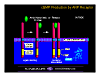
Protein Microarrays
| Chart | Title |
|---|---|
 | Kinex™ Antibody Microarrays – Step 4 – Protein Binding to Array Click here to view. |
 | Kinex™ Antibody Microarrays – Step 3 – Incubation with Array Click here to view. |
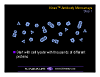 | Kinex™ Antibody Microarrays – Step 1 – Protein Lysate Click here to view. |
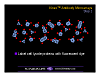 | Kinex™ Antibody Microarrays – Step 2 – Protein Labelling Click here to view. |
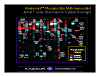
 | Kinex™ Antibody Microarrays – Positive and Negative Results Click here to view. |
 | Kinex™ Antibody Microarrays – Step 5 – Removal Unbound Protein and Quantitation Click here to view. |
 | Reverse Microarray Format Click here to view. |
 | Pan–Phospho Antibody in Sandwich Microarray Format Click here to view. |
Miscellaneous
| Chart | Title |
|---|---|
 | 2D Gel Electrophoresis — Siliver Stained Click here to view. |
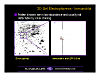 | 2D Gel Electrophoresis — Immunoblot Click here to view. |
 | Examples of Agonists that Induce Phosphatidylcholine Breakdown Click here to view. |
 | Amino Acid Sequence of Proteins Click here to view. |
 | Activation of cAMP–dependent Protein Kinase Click here to view. |
 | cGMP Production by ANP Receptor Click here to view. |
 | Comparative Genomics Across Species Click here to view. |
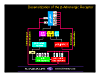 | Desensitization of the ?–Adrenergic Receptor Click here to view. |
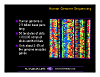
 | Gene Families in Human Genome Click here to view. |
 | Gene (DNA) Microarrays Click here to view. |
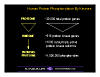
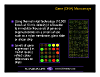
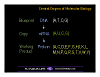 | Central Dogma of Molecular Biology Click here to view. |
 | Human Genome Sequencing Click here to view. |
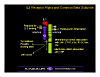 | IL3 Receptor Alpha and Common Beta Subunits Click here to view. |
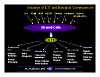 | Induction of IL11 and Biological Consequences Click here to view. |
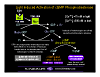 | Light Induced Activation of cGMP Phosphodiesterase Click here to view. |
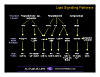 | Lipid Signalling Pathways Click here to view. |
 | Volume Occupied by Major Intracellular Compartments in a Typical Cell Click here to view. |
 | Examples of Protein and Peptide Extracellular Mediators Click here to view. |
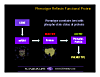 | Phenotype Reflects Functional Protein Not mRNA Click here to view. |
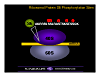 | Ribosomal Protein S6 Phosphorylation Sites Click here to view. |
 | Structure of Rous Sarcoma Virus Genome Click here to view. |
| Signal Transduction Overview Click here to view. | |
 | Summary of Total Kinase Gene Expression Click here to view. |
| Transcriptomics with Gene (DNA) Microarrays Click here to view. |